- Published on
Introducing Insights: From chat to charts, all in one place
You know that feeling when you ask a question about your data, get a SQL query back, and then realize may it would be better to see it as a chart? Or maybe you want to understand what the query is actually doing before you run it?
Right now, that means jumping between different views, having to ask more questions in the chat, or even having to export the query results and asking ChatGPT to generate a query from it.
We've been there. And that's why we built Insights.
What Are Insights?
Think of Insights as your data questions, fully realized.
Here's a real-world scenario: you want to get a “distribution of the most purchased products over the last six months".
If you weren't using Text2SQL.ai you'd need to know in which database tables this data exists, manually get their definitions and send it to a LLM to hopefully get a decent query.
Then, you would need to go to where you runs your database queries and paste that query and run it. Only after that, you'd export the data and send it to another LLM to finally get a chart of your data.
But what if you need to tweak something? There goes the whole process again…
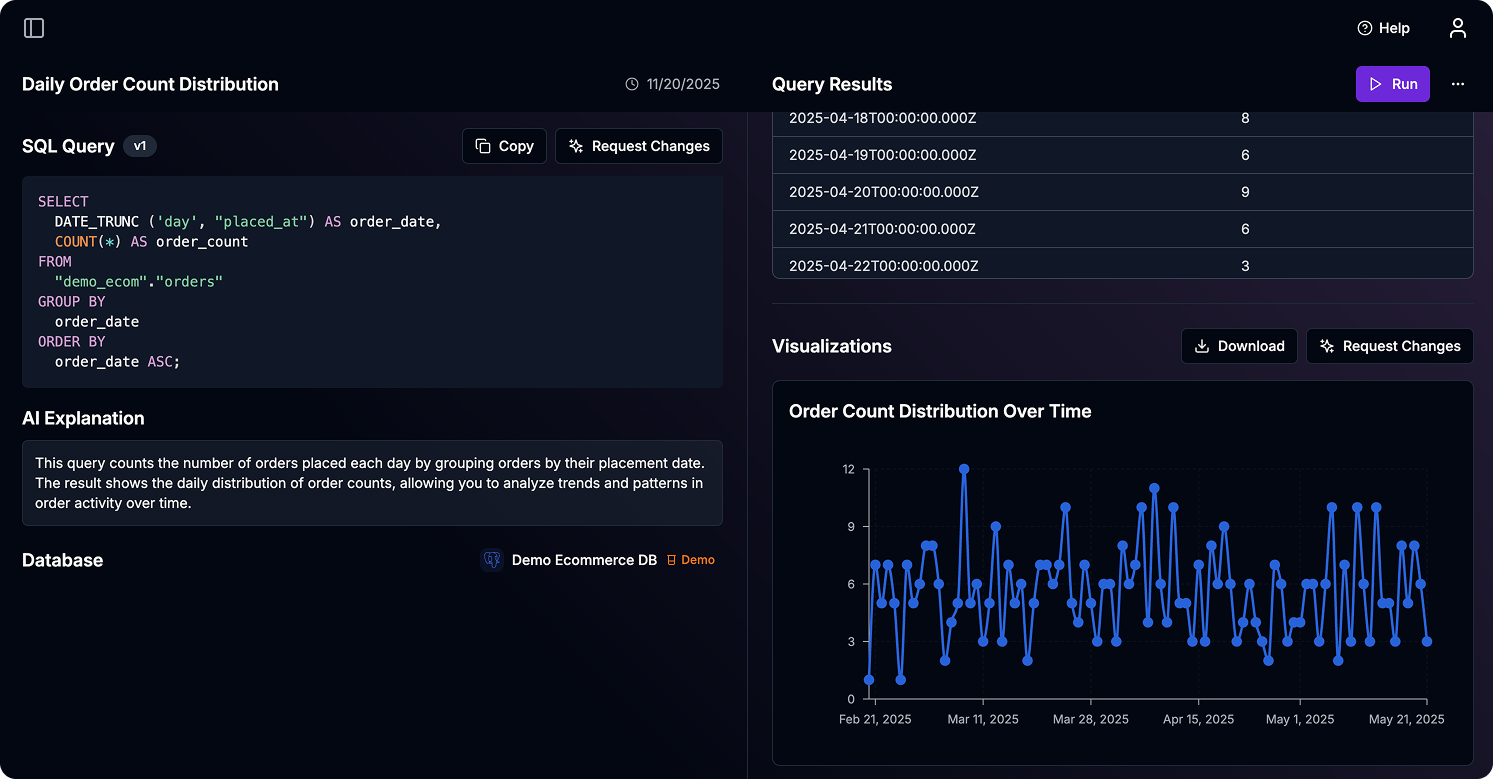
With Text2SQL.ai, it's faster. Our AI knows and understands your whole database schema, understands what you're asking for, and then gives you everything you need in one unified view:
- The SQL query it generated (so you can see exactly what it's doing)
- A clear explanation of what the query does
- The actual results in a table
- A chart that makes sense of the data
All of this happens automatically. You don't need to configure charts manually and guess which columns to use. The AI figures out the best way to visualize your data based on what you asked for.
Why We're Moving Beyond Chat
We still think there's a reason why chat interfaces are so popular. They're familiar, they're conversational, and they work great for a lot of things. But when you're trying to analyze data, chat can feel limiting.
You're scrolling through a conversation history, trying to remember which query produced which result, and if you want to see something differently, you're starting a whole new conversation.
It's not as good of an experience as it could be.
Insights change that. Each insight is a self-contained unit. It has a name, a description, the query, the results, and the visualization—all right there. You can see everything at once.
You can ask for changes individually without losing context. And most importantly, you can actually understand what's happening with your data.
How It Works
Let's walk through what happens when you create an insight.
You type your question: "Show me monthly revenue trends for the past year."
Behind the scenes, the AI looks at your database schema, understands your table relationships, and figures out the best way to answer your question. It generates a SQL query that's tailored to your specific database structure.
Then it runs that query and gets your results. But here's where it gets interesting: the AI also generates a chart definition. It looks at your data and decides "this should be a line chart" or "this needs a bar chart" or "let's use a pie chart here." It picks the right columns for the axes, formats the data appropriately, and creates something that actually makes sense.
Easily Making Changes
Sometimes the AI gets it almost right, but not quite. Maybe the chart needs different axes. Maybe the query should filter out test data. Maybe you want to see it grouped differently, for another period of time for example.
With Insights, you can just ask for changes in each part of the insight. "Can you exclude test orders from this?" or "Show this as a bar chart instead" or "Group by month instead of week."
The AI understands the context of your current insight. It knows what query you're working with, what data you're looking at, and what you're trying to achieve. So when you ask for a change, it updates exactly what it needs to, the query, the results, the chart or the description.
What This Means for You
If you're a business analyst, this is huge. You can explore your data, see visualizations immediately, and iterate on your questions without breaking your flow. You don't need to know SQL. You don't need to know how to configure charts. You just need to know what question you want to answer.
If you're a data engineer or developer, you get transparency. You can see exactly what SQL is being generated. You can verify it's doing what it should. And you can share these insights with your team knowing they'll understand what they're looking at.
The Bigger Picture
Insights are the foundation for what's coming next. Soon, you'll be able to create dashboards that combine multiple insights. Want to see revenue trends alongside customer acquisition? Just add both insights to a view.
And dashboards? They're coming. You'll be able to build dashboards with multiple insights, arrange them how you want, and share them with your team. All the insights stay live, so when your data updates, your dashboards update too.
But we're getting ahead of ourselves. For now, Insights give you a better way to work with your data. One question, one place, everything you need.
Try It Out
Insights are available now. If you're already using Text2SQL.ai, you'll see the new interface when you create a new insight. If you're new here, sign up and connect your database to get started.
Have questions? We're here to help. Reach out at support@text2sql.ai or use the in-app chat.
Your data has stories to tell. Insights help you hear them.